Investment Thesis
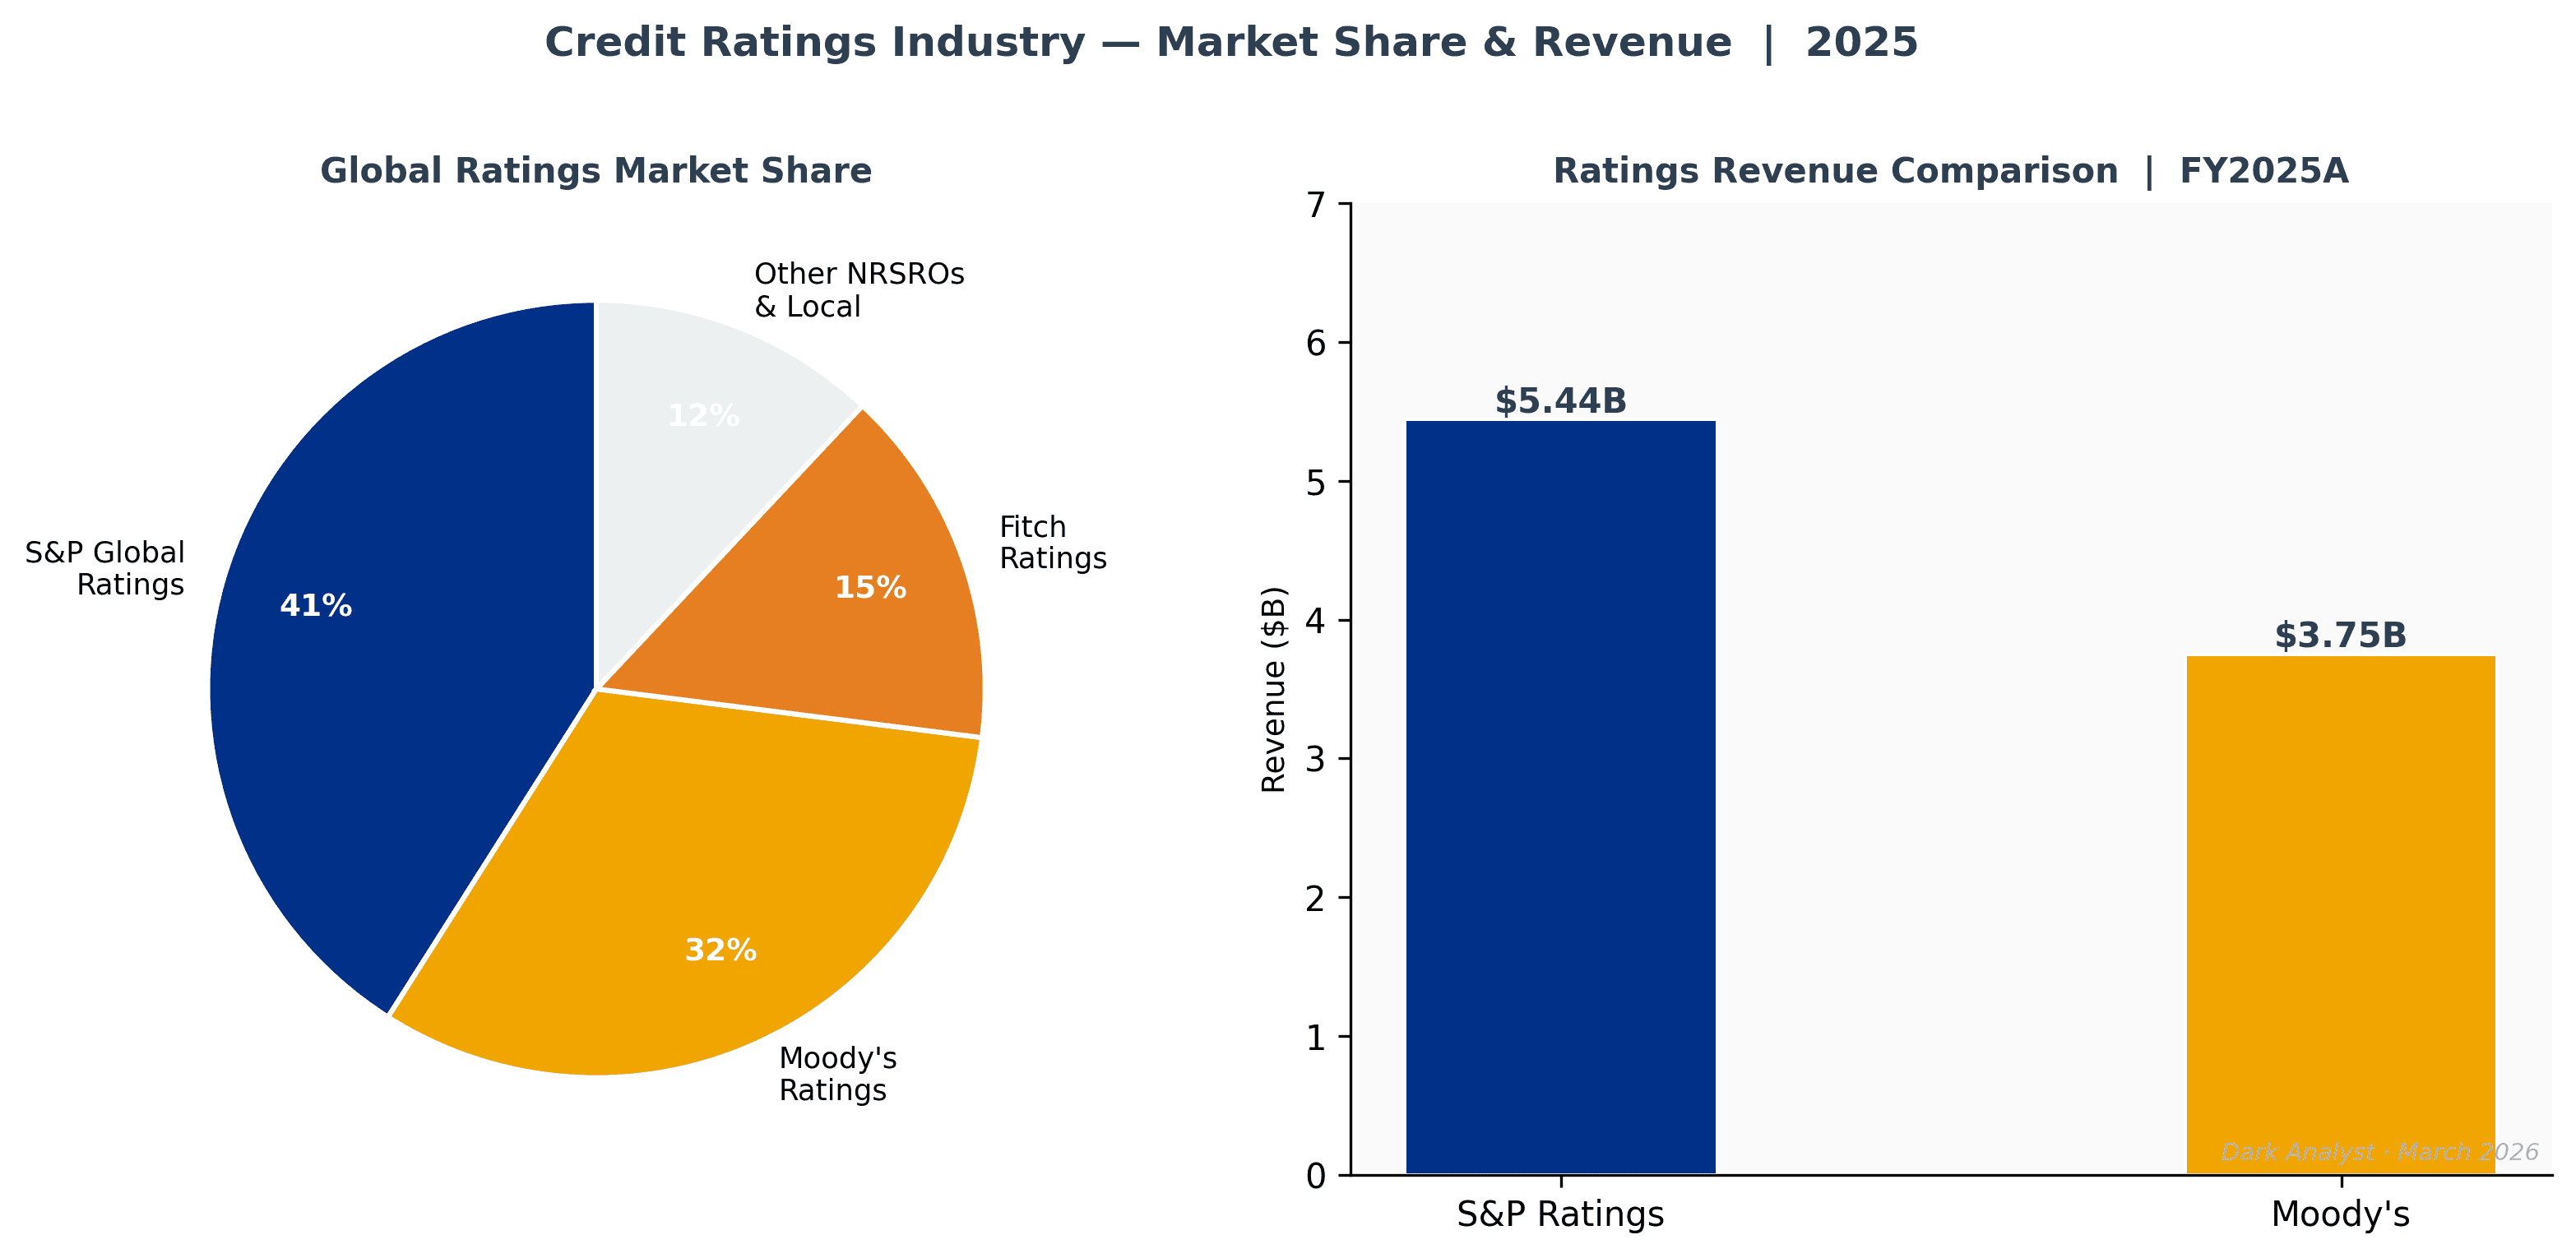
S&P Global is one of the most asymmetric large-cap opportunities in US financial services. Together with Moody's, it controls approximately 80% of global debt ratings — a market structure unchanged in any meaningful way since the Credit Rating Agency Reform Act of 2006. That reform, intended to introduce competition, instead reinforced the institutional necessity of an S&P or Moody's imprimatur for any debt that needs to access global capital markets. The business has only become more essential in the twenty years since.
Two fears drive the current market discount: that AI will displace Market Intelligence analytics, and that the 2026 ratings volume outlook is soft. Both are overstated. S&P owns the regulatory rulebook that AI tools are required to reference. You cannot ask a language model to invent a credit rating, substitute an S&P 500 index, or replace a Platts benchmark — those outputs require NRSRO regulatory standing and decades of institutional trust. Rather than being disrupted, S&P is positioned as the mandatory data layer for AI-powered financial applications: the company holds active partnerships with Microsoft (Copilot), Google (Gemini Enterprise), and OpenAI, and management has been explicit that every customer accessing S&P data through an LLM provider must hold a direct contract with S&P Global. Twenty new AI-powered products launched in FY2025, including Kensho-integrated search in Capital IQ Pro and automated data ingestion in iLEVEL that hit 20% add-on adoption within six months. The moat absorbs AI — it does not lose to it.
Private credit is the more important and under-appreciated growth vector. The global private credit market has expanded from approximately $700 billion in 2018 to $2.3 trillion in 2025 and is projected to reach $4.5 trillion by 2030 — a 15% CAGR. These markets have historically operated without the data infrastructure, benchmarks, and monitoring tools that public markets take for granted. S&P is building that infrastructure: iLEVEL for portfolio monitoring, credit estimates and private ratings for lenders, With Intelligence (acquired November 2025) for LP-GP capital flow tracking. Private markets revenue grew 16% in FY2025, and management identified private markets as a core high-growth adjacency at its November 2025 Investor Day. On top of this organic growth, we expect the private credit cycle to produce a blow-up and regulatory response in 2026 — which historically drives formal rating mandates, greater data transparency requirements, and deeper adoption of monitoring infrastructure. The implosion we expect will, in our view, be net additive to S&P's long-term revenue opportunity.
Near-term, elevated interest rates compress new issuance volumes in public bond markets. As rate normalization progresses into late 2026 and 2027, the ratings pipeline should re-open materially. We are buying the business at a digestion point between two periods of strong issuance growth.
Business Overview
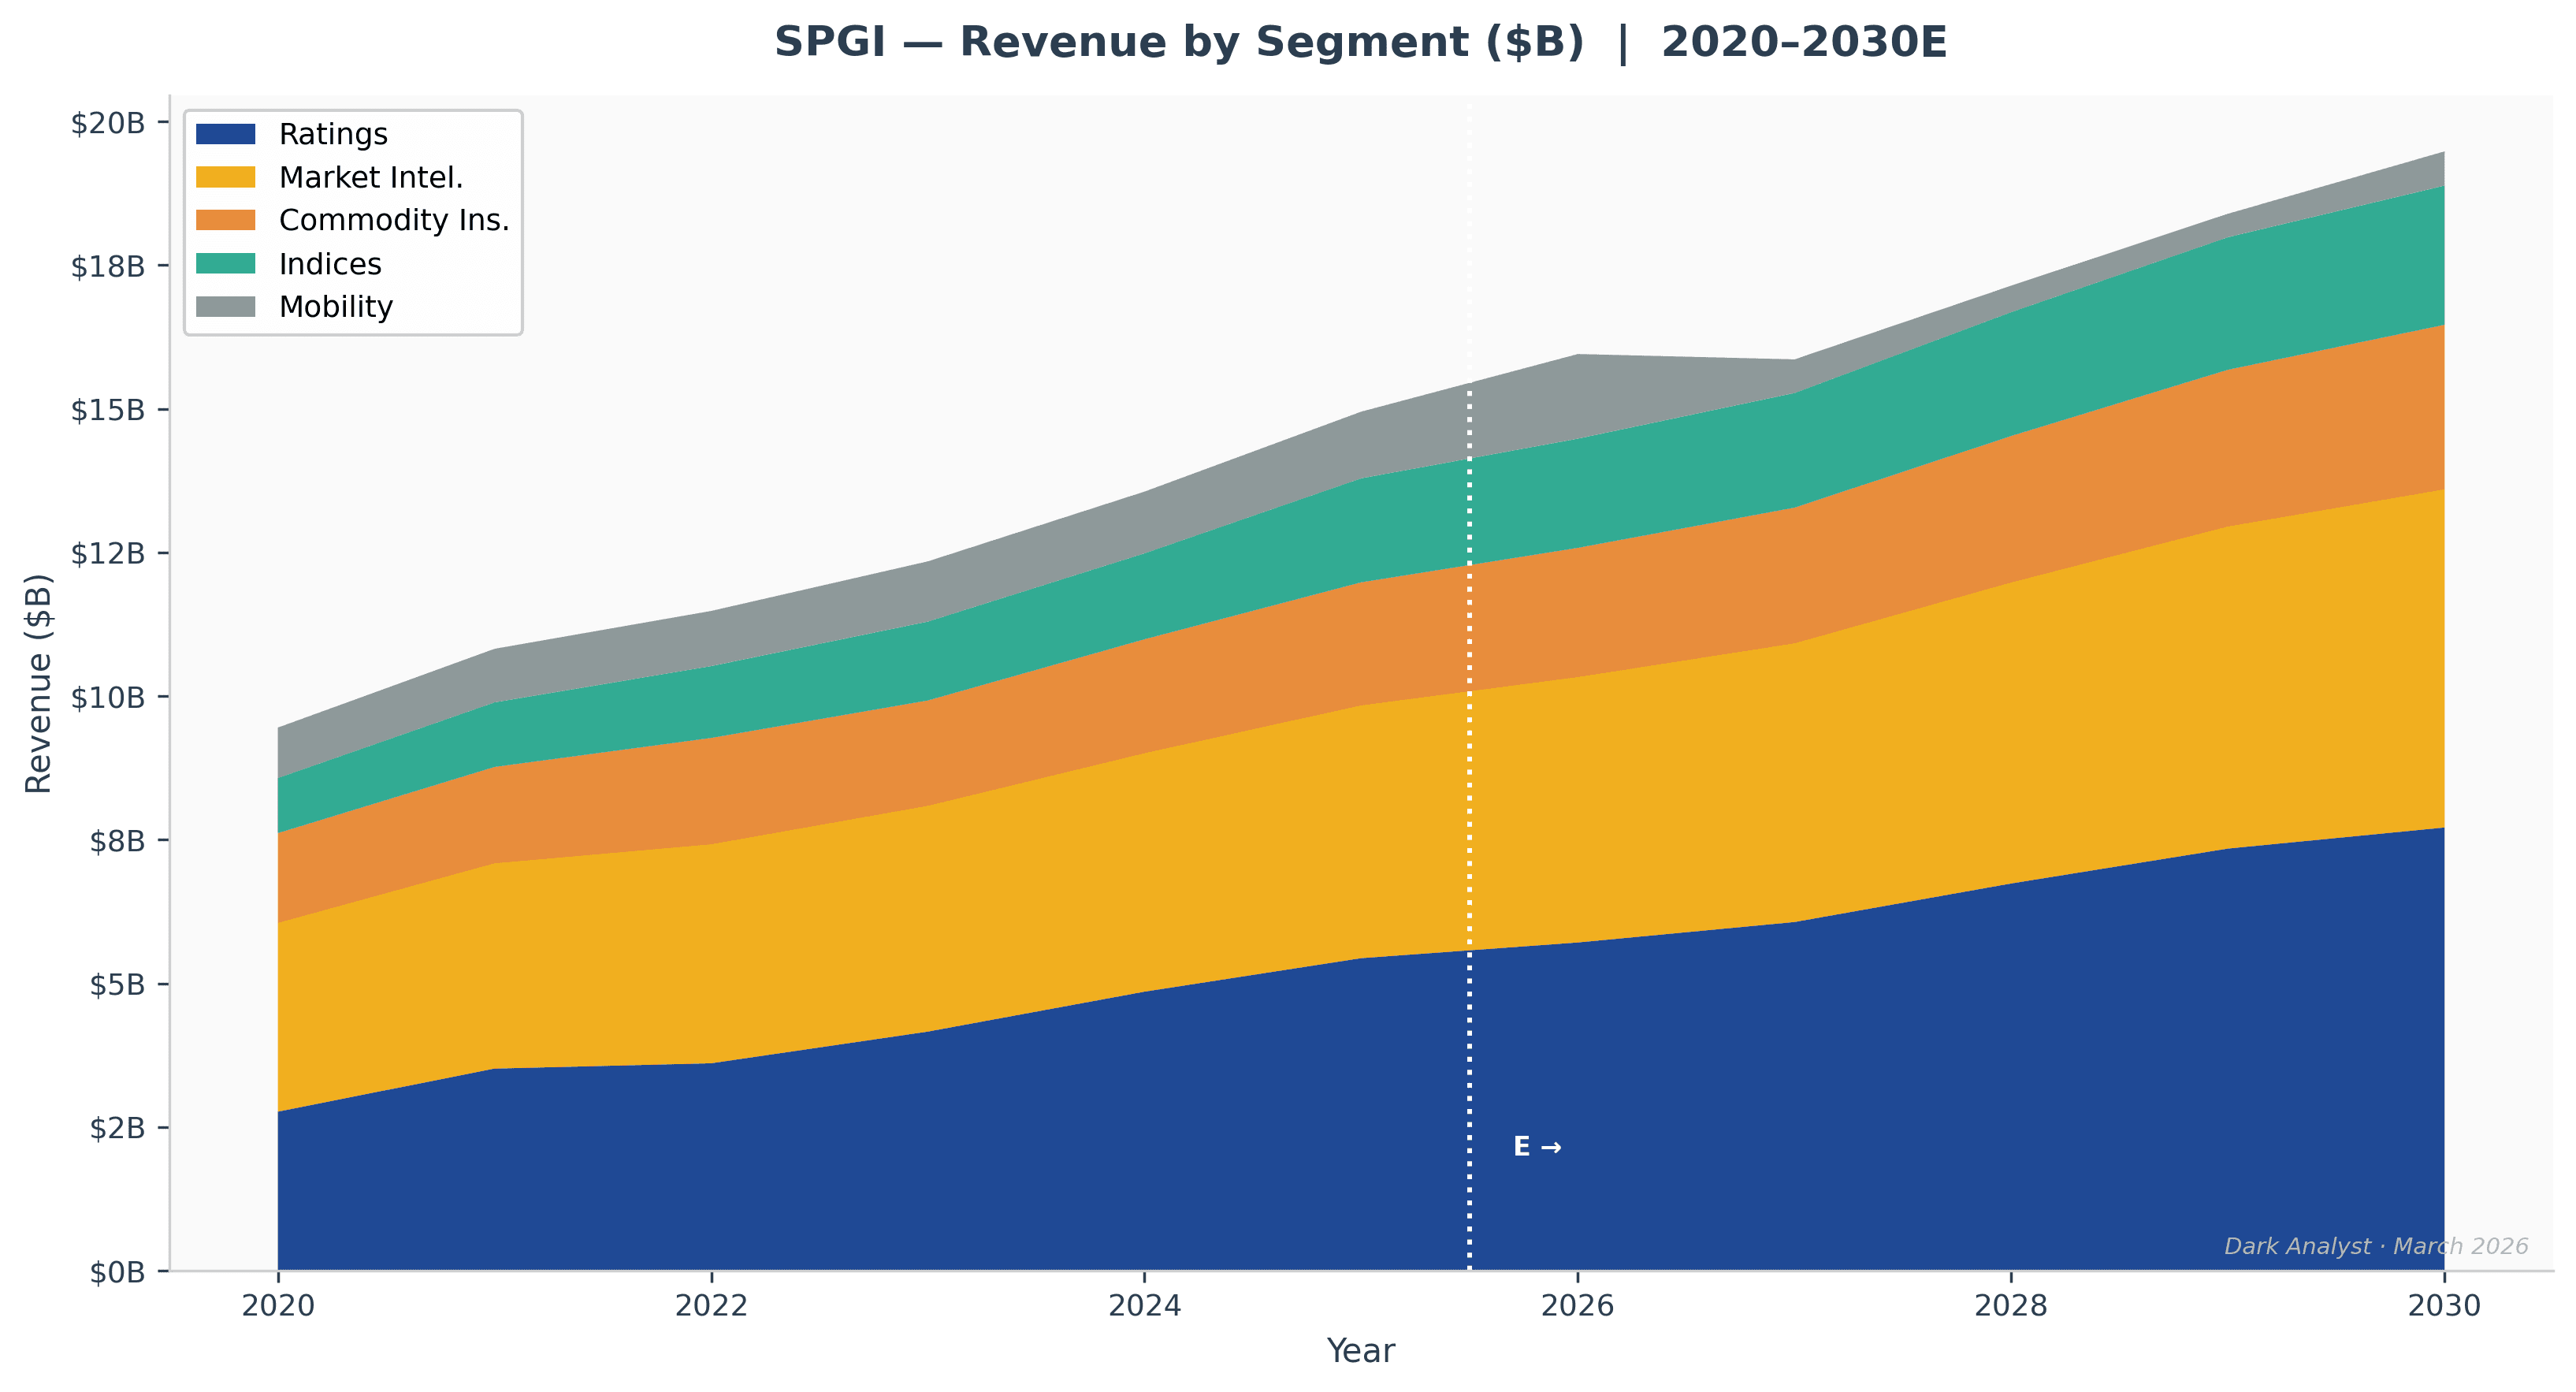
S&P Global operates four reporting segments following its announced spin-off of the Mobility division (expected H2 2026 as a standalone public company, Mobility Global):
Market Intelligence accounts for roughly 32% of revenue, growing at 6–7% annually with operating margins around 34%. The segment sells financial data, analytics, and workflow tools — primarily Capital IQ Pro desktop terminals, SNL sector databases, iLEVEL private markets monitoring, and enterprise data feeds. Approximately 85% of revenue comes from subscriptions. The business is not the Bloomberg Terminal. Bloomberg owns the trading desk — real-time prices, news, and execution analytics for the front office. Capital IQ Pro owns the back office: the deep financial models, credit analysis, M&A databases, and risk system data feeds used by bankers, researchers, and corporate development teams. At large banks, both run simultaneously on different desks. That segmentation is why neither displaces the other — and why AI disruption concerns are overstated for this segment: S&P's proprietary underlying datasets (CRISIL credit data, private markets monitoring, RatingsXpress feeds) cannot be replicated by any generative AI tool.
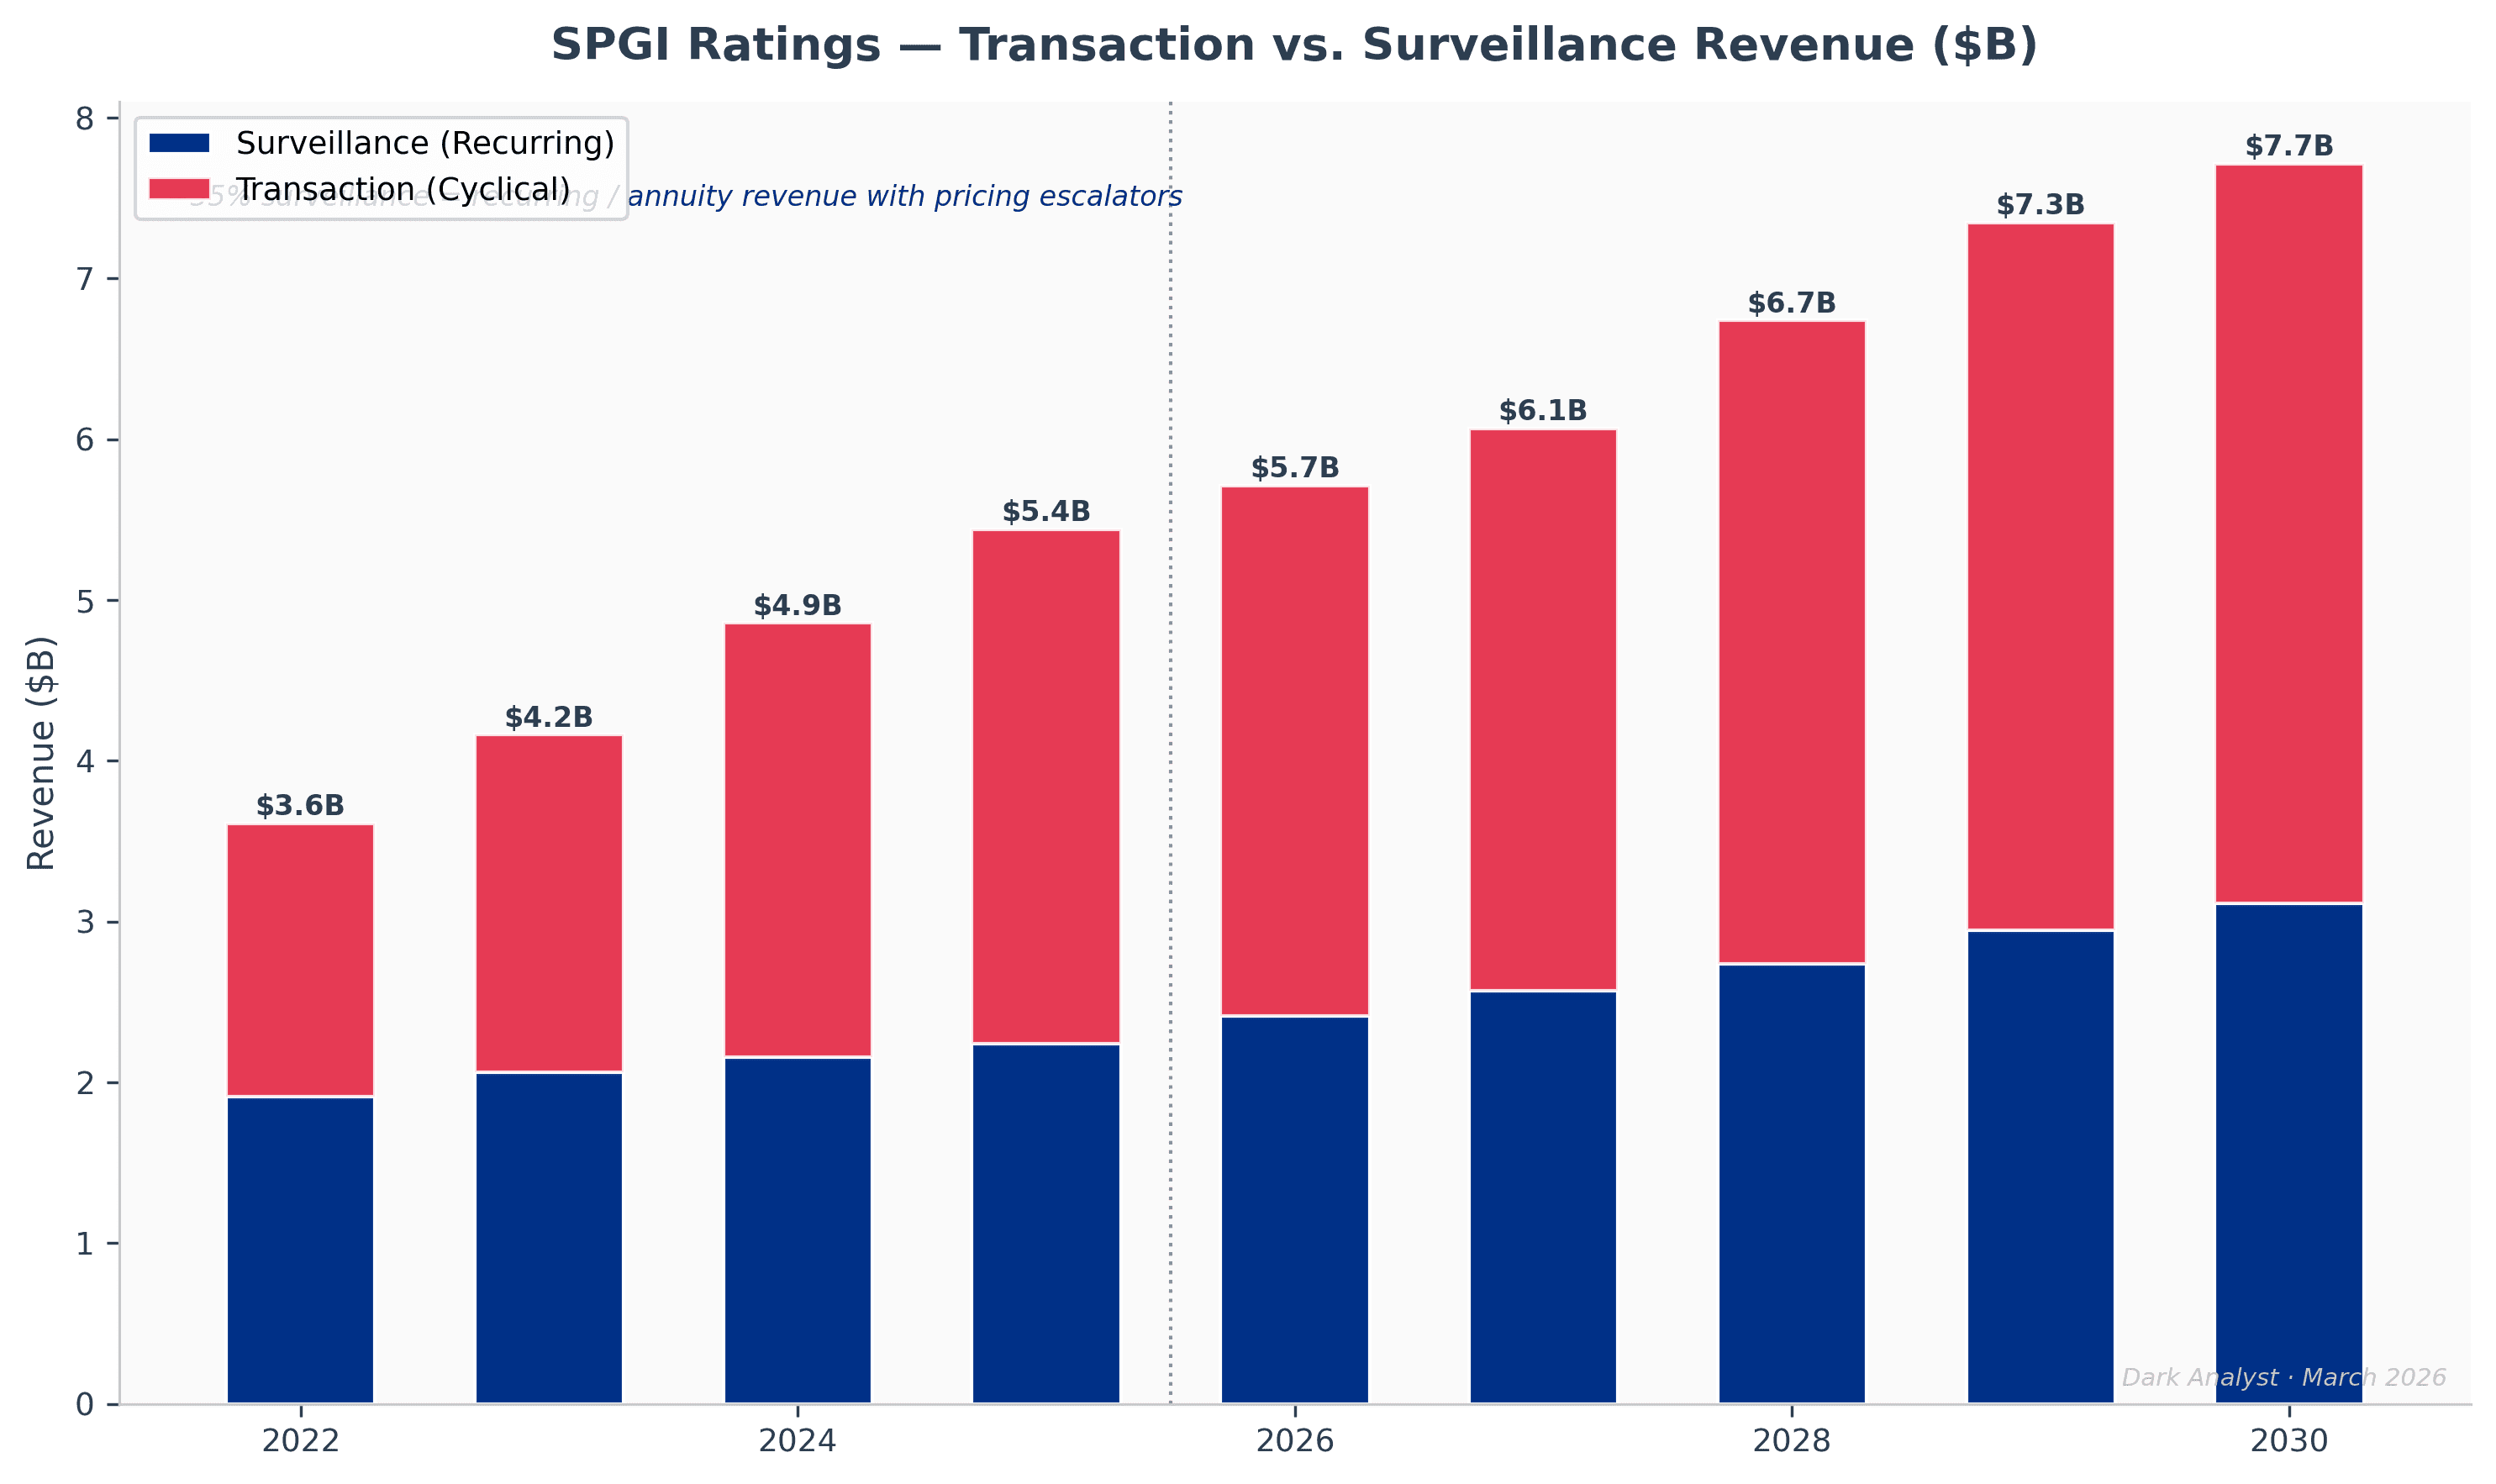
Ratings accounts for 31% of revenue, growing 8% annually, at approximately 65% operating margins — among the highest of any business in financial services. Issuers pay S&P to rate their bonds because investors require it. There is no substitute. S&P structures fees as basis points per dollar of issuance: 4.25 basis points in 2007, 6.25 basis points in 2016, 8.35 basis points today. Compound pricing growth of 3–4% per year, every year, for two decades, on an issuer base with no alternative. Beyond transaction fees, surveillance revenues — annual fees on outstanding rated debt — now build a growing non-cyclical recurring base beneath the issuance-driven business.
Commodity Insights accounts for 15% of revenue, growing 7%, with roughly 45% margins. This is the Platts benchmark business: reference prices for Dated Brent crude, Henry Hub natural gas, LNG, metals, and agricultural commodities written into long-term physical delivery contracts globally. Once a Platts price assessment enters a multi-year supply contract, it cannot change until the contract expires. Contract law protects this recurring revenue.
S&P Dow Jones Indices accounts for 12% of revenue at approximately 71% operating margins — the highest in the company. It runs a near-pure royalty model. The S&P 500 serves as the benchmark for the world's largest ETFs (SPY, IVV, VOO — over $2 trillion in combined AUM), the most actively traded options (SPX on CBOE), and the most liquid futures (ES on CME). Every dollar of passive fund inflow, every index future traded, every volatility event that drives options volume generates royalty income for SPGI with near-zero marginal cost.
Mobility, at 11% of revenue, houses CARFAX and automotive intelligence businesses with limited synergy to the financial intelligence core — hence the spin-off.
Group-wide, approximately 85% of revenue is subscription or recurring in nature.
Financial Analysis
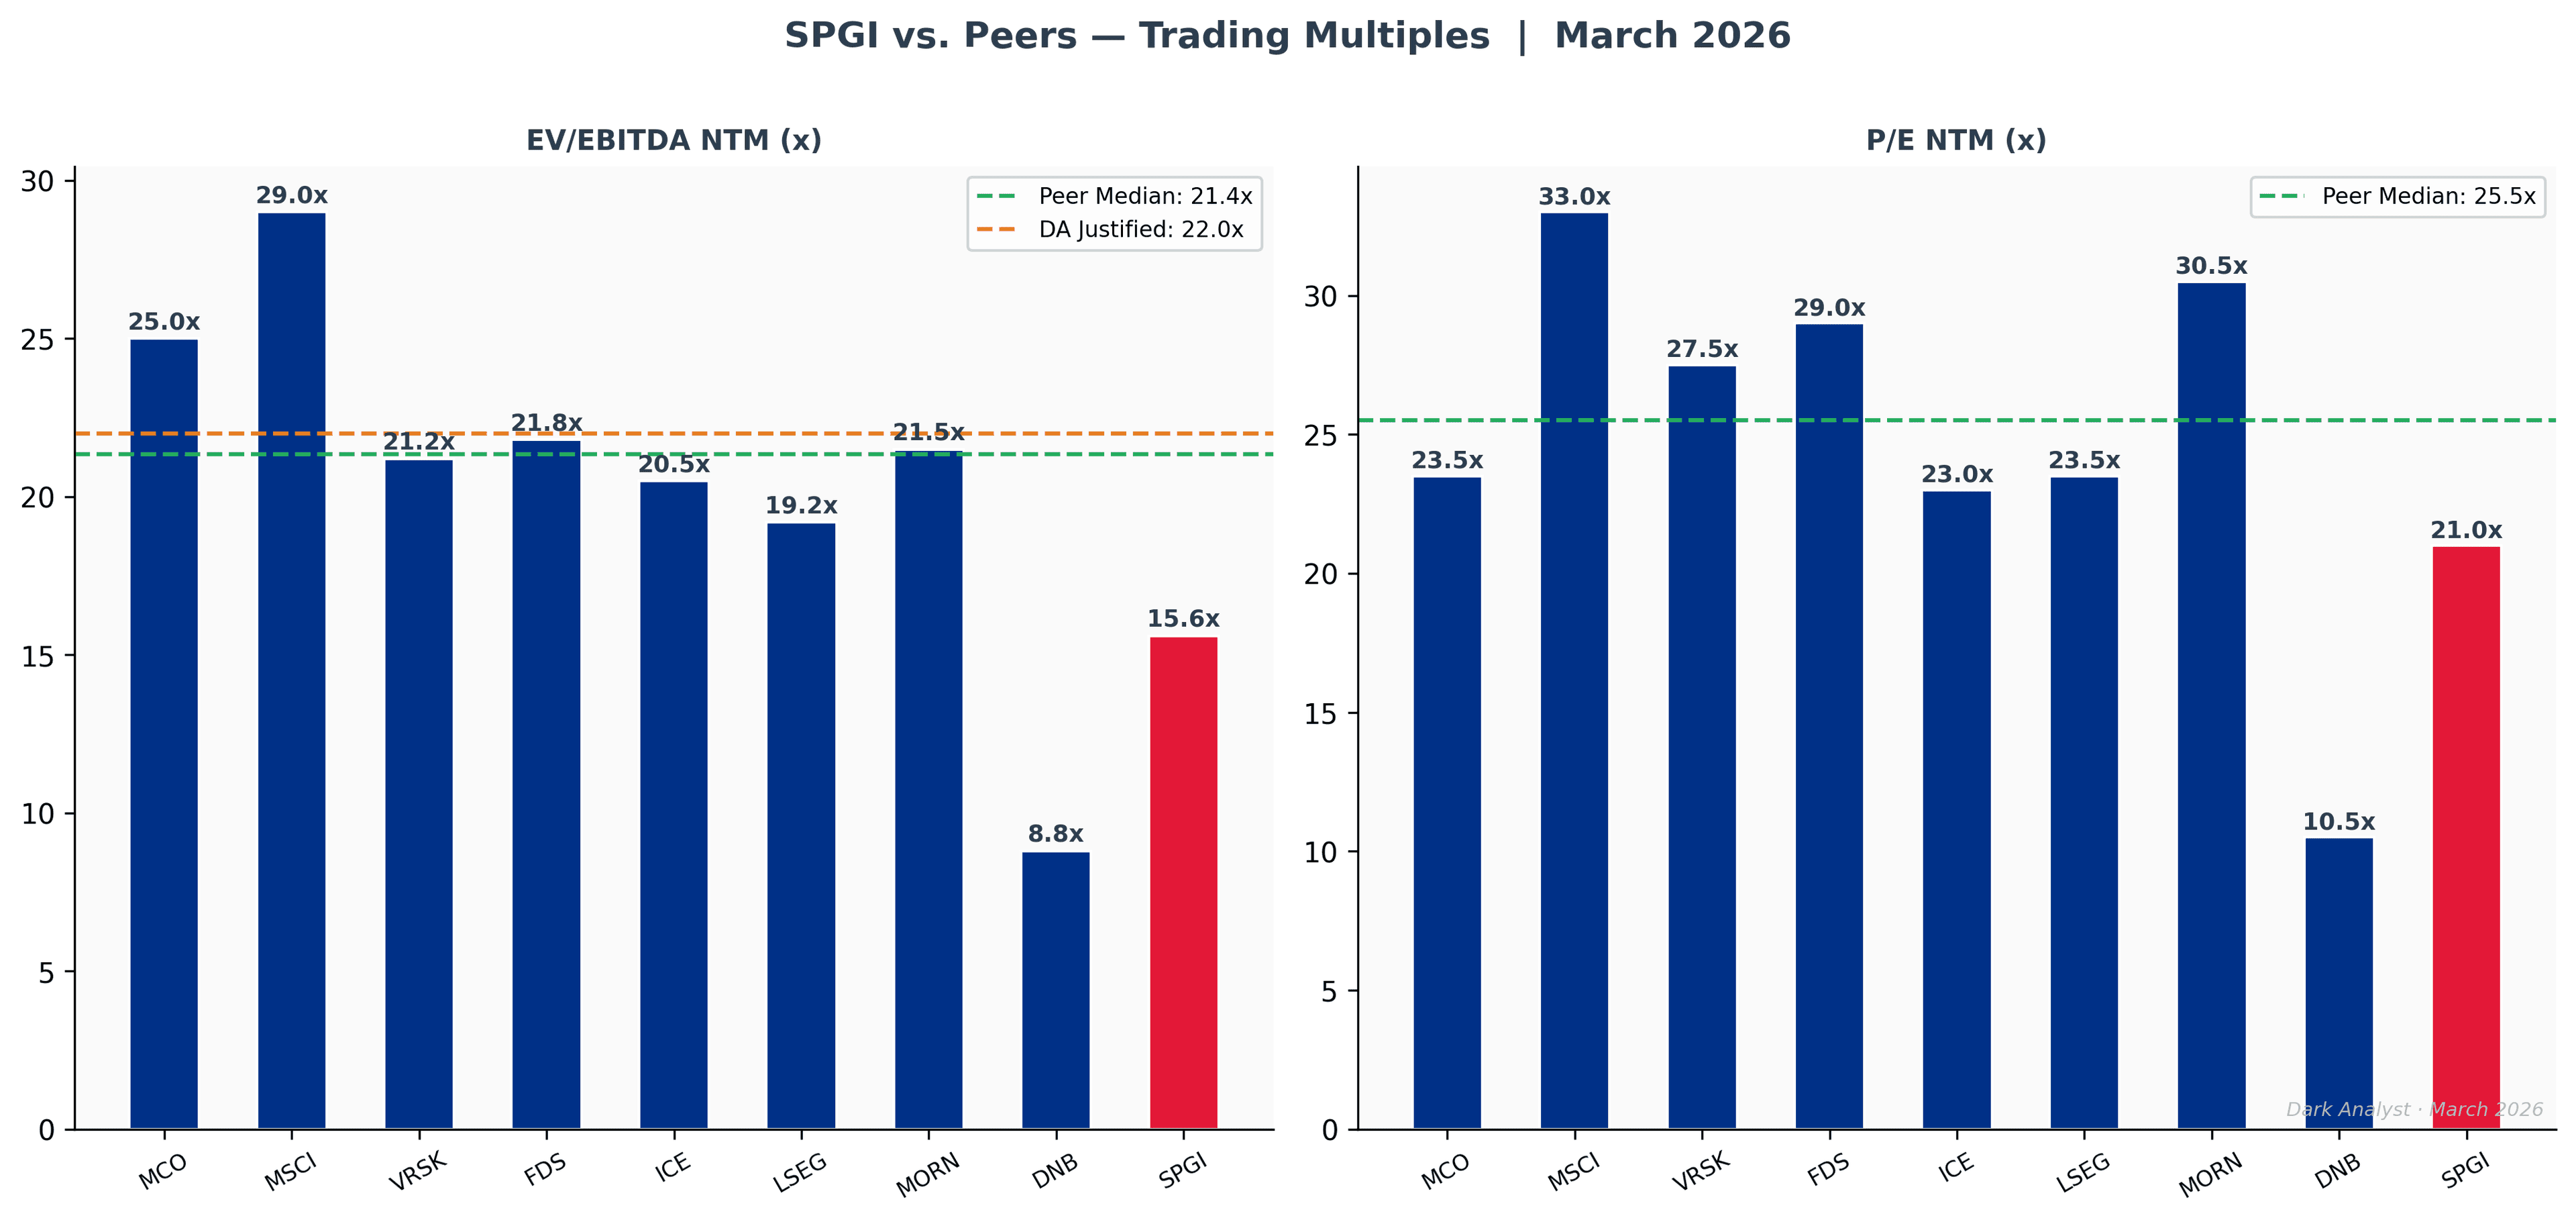
Pillar 1 — The conglomerate discount is at a maximum, and temporary. SPGI currently trades at approximately 15.6x NTM EV/EBITDA. Moody's, its most direct peer, trades at 25.0x. MSCI, which runs an Indices business architecturally identical to S&P Dow Jones Indices, trades at 29.0x. The six-turn discount to MCO and the thirteen-turn discount to MSCI are not explained by SPGI's business quality or growth — they reflect a classic conglomerate discount applied to a multi-segment financial intelligence company. The Mobility Global spin-off, expected H2 2026, forces the market to value SPGI's remaining segments on a disaggregated basis. Our SOTP assigns each segment a standalone multiple: Ratings at 25x (MCO-equivalent), Indices at 30x (MSCI-equivalent), Market Intelligence at 21x (Verisk/FactSet comp), and Commodity Insights at 20x. The resulting SOTP enterprise value of $173.5B implies $528/share before any holdco discount — a 28% premium to today's price without a single dollar of earnings growth required.
Pillar 2 — AI disruption risk is cyclical noise, not structural impairment. The consensus bear thesis holds that generative AI will eliminate analyst jobs and compress seat counts for Capital IQ Pro. The risk is real but overstated for two structural reasons. First, SPGI's highest-margin businesses — Ratings and Indices — carry no AI substitution risk: regulatory legitimacy cannot be replicated by an LLM, and index methodology is governed by rules committees, not analyst judgment. Second, within Market Intelligence — where the AI risk is concentrated — S&P is repositioning from a seat-based model toward a data infrastructure model. Partnerships with Microsoft (Copilot), Google (Gemini Enterprise), and OpenAI (MCP connector) position SPGI's proprietary datasets as the trusted data layer for AI-powered financial applications. Every AI agent that accesses SPGI credit data, index data, or commodity assessments must hold a direct contract with S&P Global — preserving commercial control over its intellectual property in an AI-native world. Q4 2025 ACV growth of 6.5–7% shows zero deterioration to date. The quantified downside from a sustained 10% seat count reduction is approximately $420M in MI revenue, reducing EPS by roughly $1.40 (7%) — significant but not existential.
Pillar 3 — Private markets is a decade-long growth vector outside consensus. The global private credit market grew from $700B in 2018 to $2.3T in 2025, and Preqin projects it reaches $4.5T by 2030 — a 15% CAGR. This market has historically operated without the benchmarks, analytics infrastructure, and credit data ecosystem that public markets take for granted. S&P is investing aggressively to become the dominant data infrastructure provider for this space: With Intelligence (acquired November 2025, tracking LP-GP capital flows), iLEVEL private markets monitoring (1,000+ PE/VC firms, AI-powered data ingestion hitting 20% add-on adoption within six months of launch), and private credit estimates and ratings growing 16% YoY in FY2025. This growth is largely absent from consensus financial models, which focus on public debt issuance cycle forecasting. If SPGI captures a 5–10% share of the analytics fee pool in a $4.5T private credit market, the incremental revenue opportunity exceeds $500M annually — more than offsetting the quantified MI seat count risk. The private credit stress we expect to materialize in 2026 will, in our view, accelerate regulatory transparency mandates and expand the addressable market further.
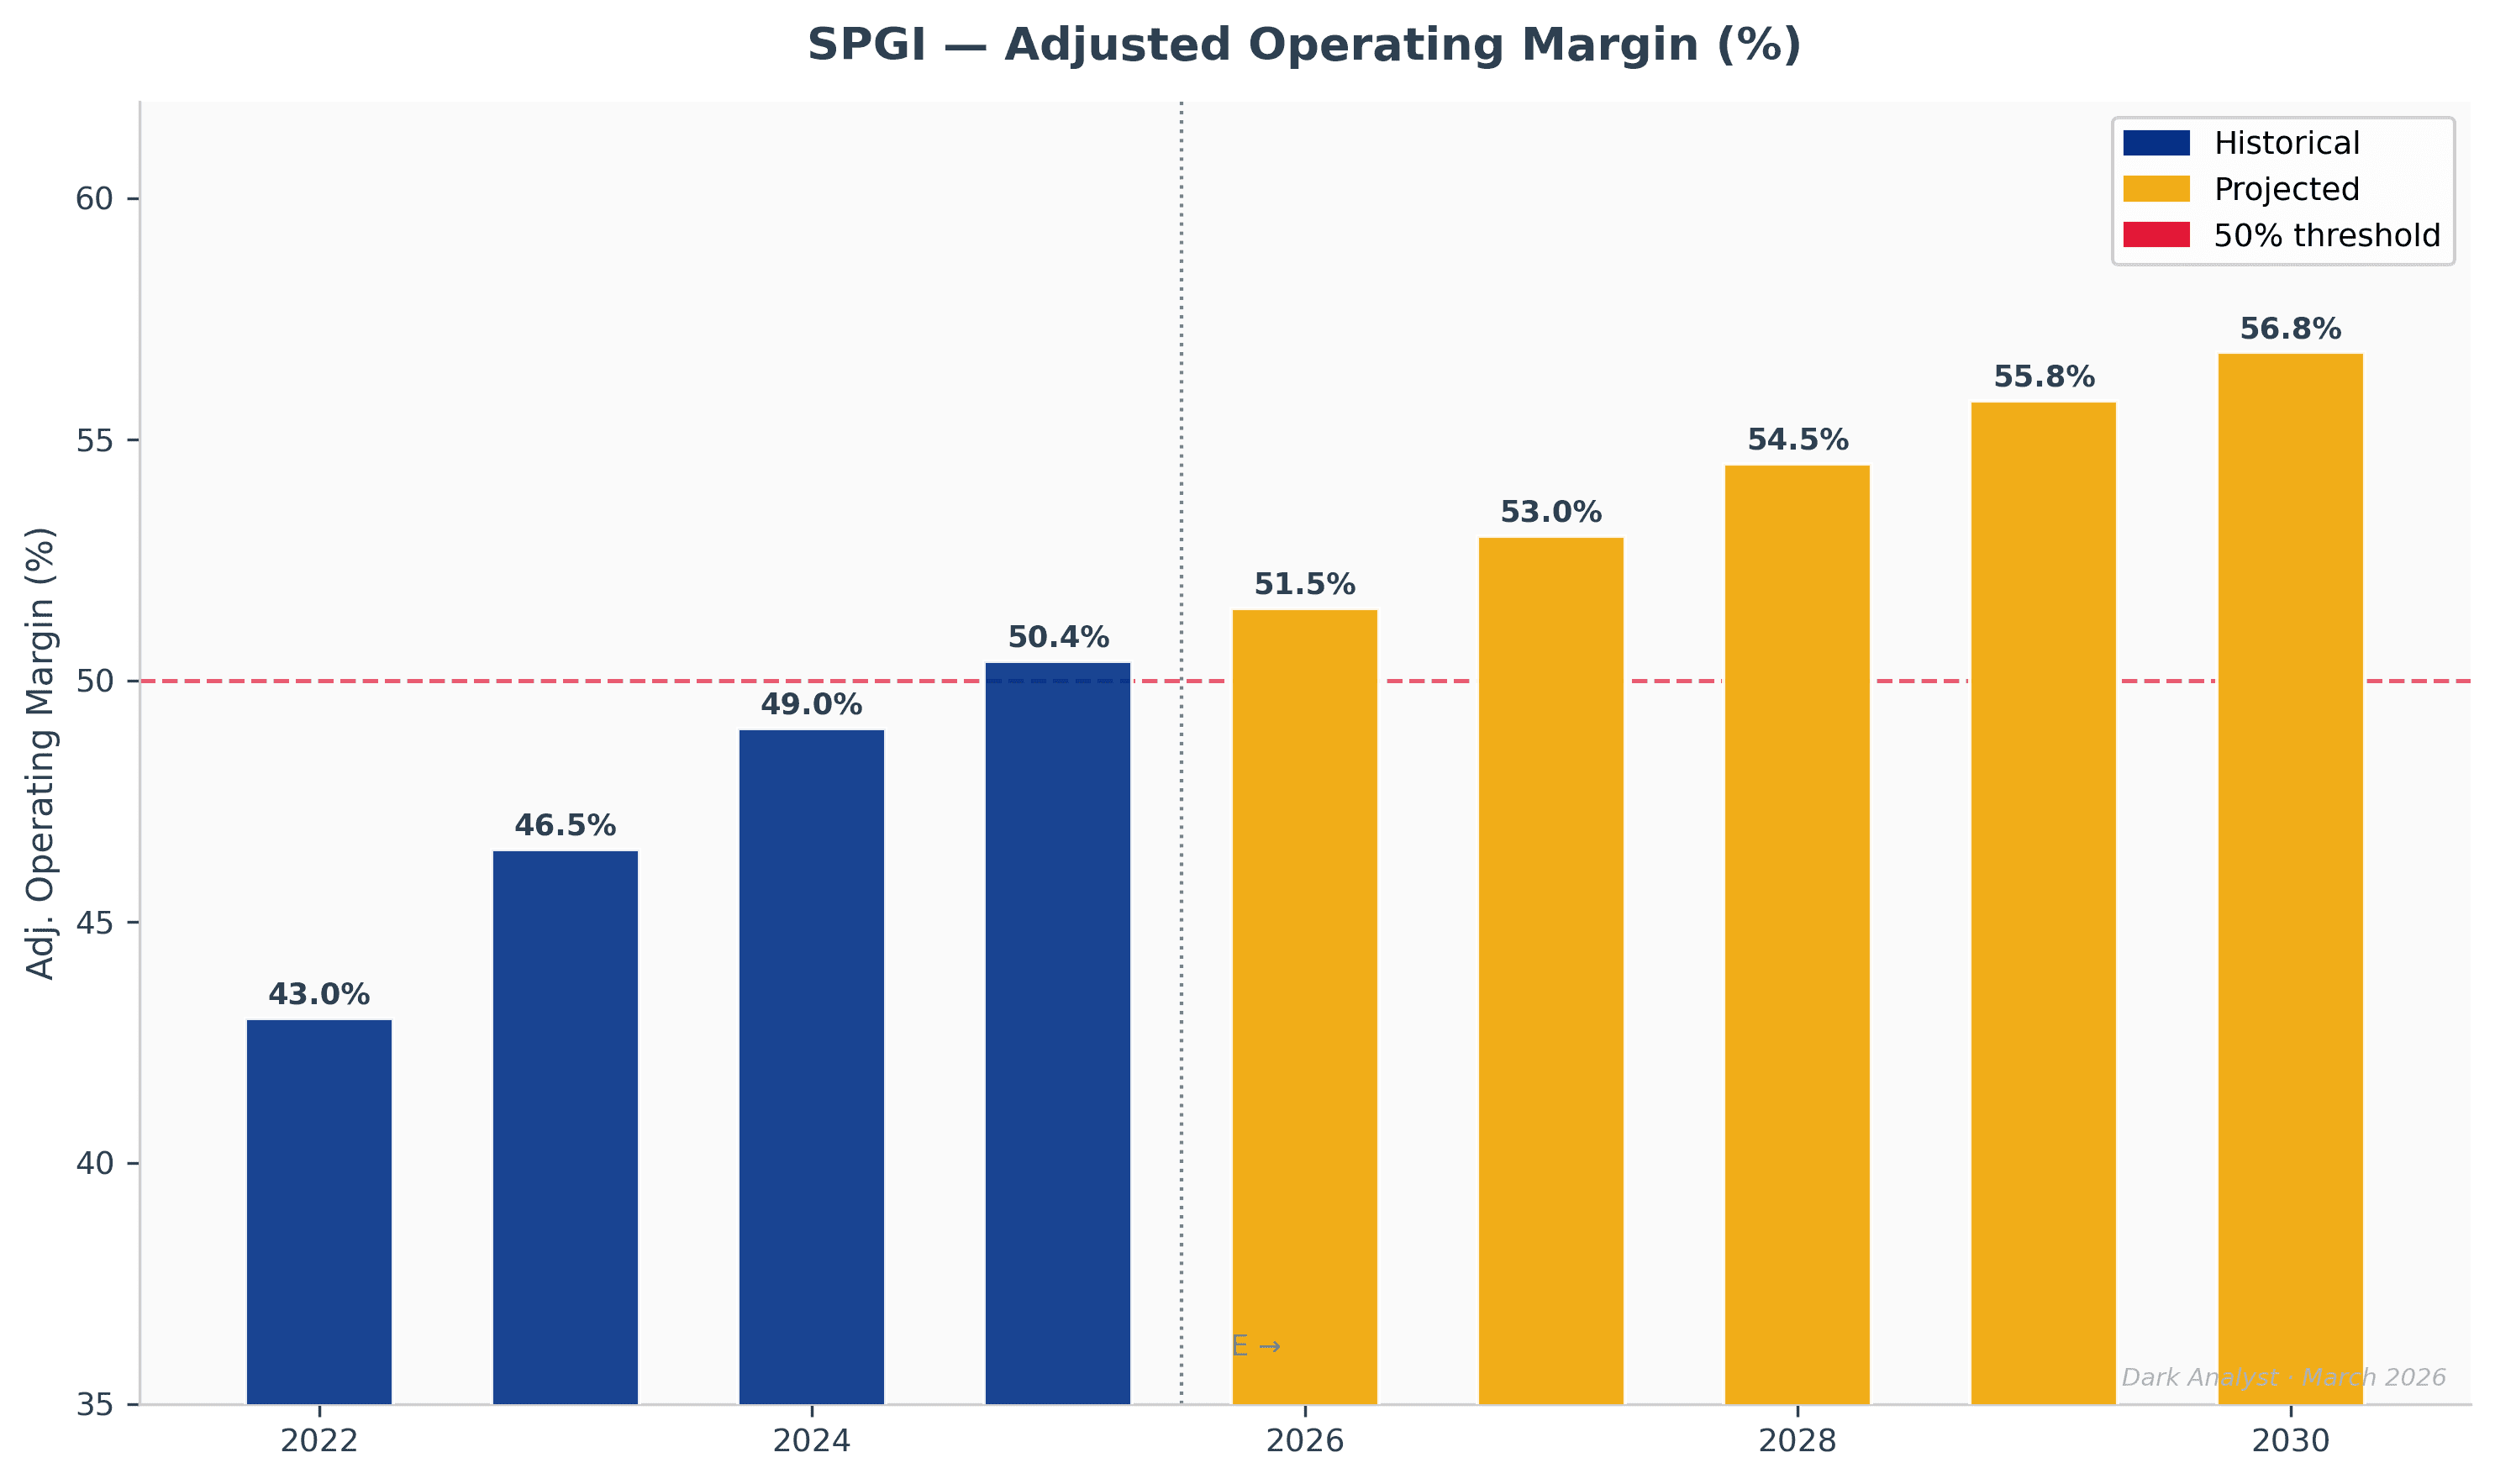
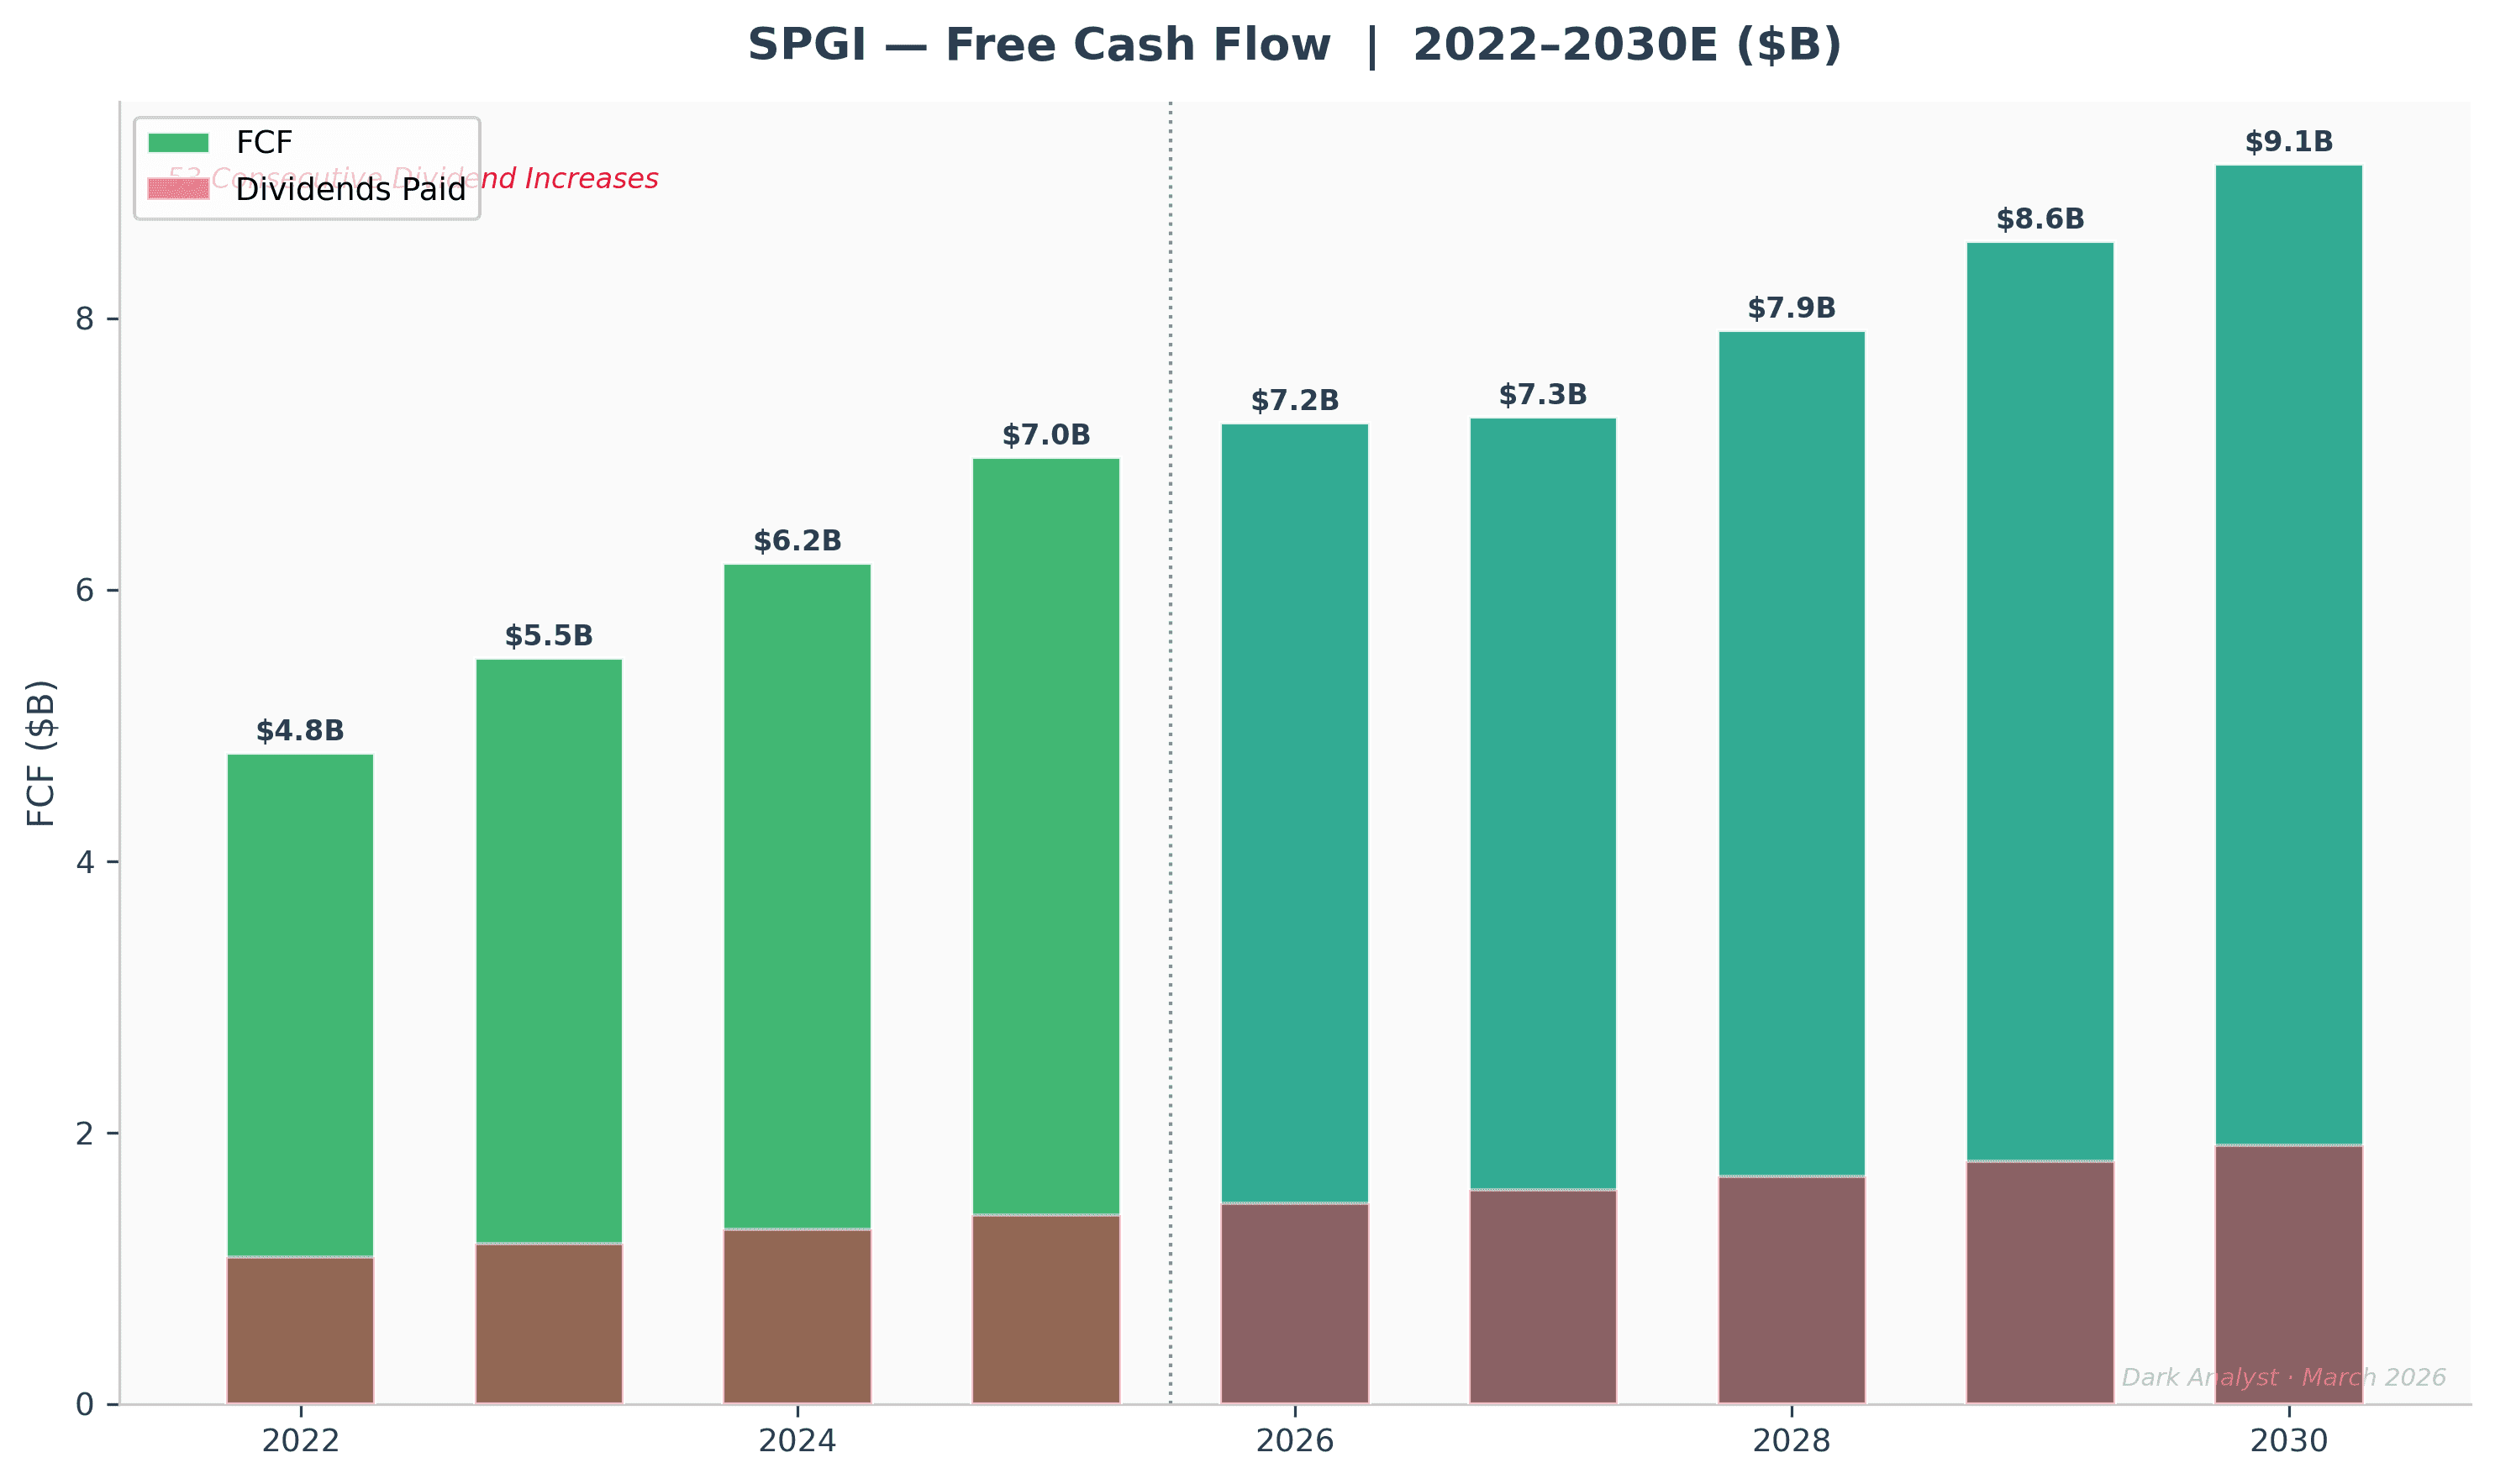
Pillar 4 — Capital return machine with 53 consecutive years of dividend growth. At current prices, SPGI offers a 5.4% adjusted FCF yield on 2026E FCF of $7.2B — attractive against a 4.4% 10-year Treasury for a business with 80%+ recurring revenue. Adjusted operating margins expanded from 34% in 2013 to 50%+ today — sixteen percentage points over twelve years with no degradation in growth, the natural result of a digital data business where adding a new customer costs almost nothing. The company returned 113% of FY2025 adjusted FCF to shareholders ($5.0B in buybacks, $710M in dividends), reducing diluted share count from 338M in 2021 to 312M in 2025. We project share count reaches approximately 274M by 2029 — a 12% reduction from today — contributing roughly 3% annual EPS accretion independent of revenue growth. At our $540 price target, SPGI would trade at approximately 27.5x FY2026E EPS, still below its 2018–2021 average of 31x. No multiple expansion required.
Valuation
At $402, SPGI trades at approximately 15.6x NTM EV/EBITDA — a six-turn discount to Moody's (25x), a thirteen-turn discount to MSCI (29x), and below the company's own five-year average multiple. Digestion-year concerns explain the discount, not structural impairment.
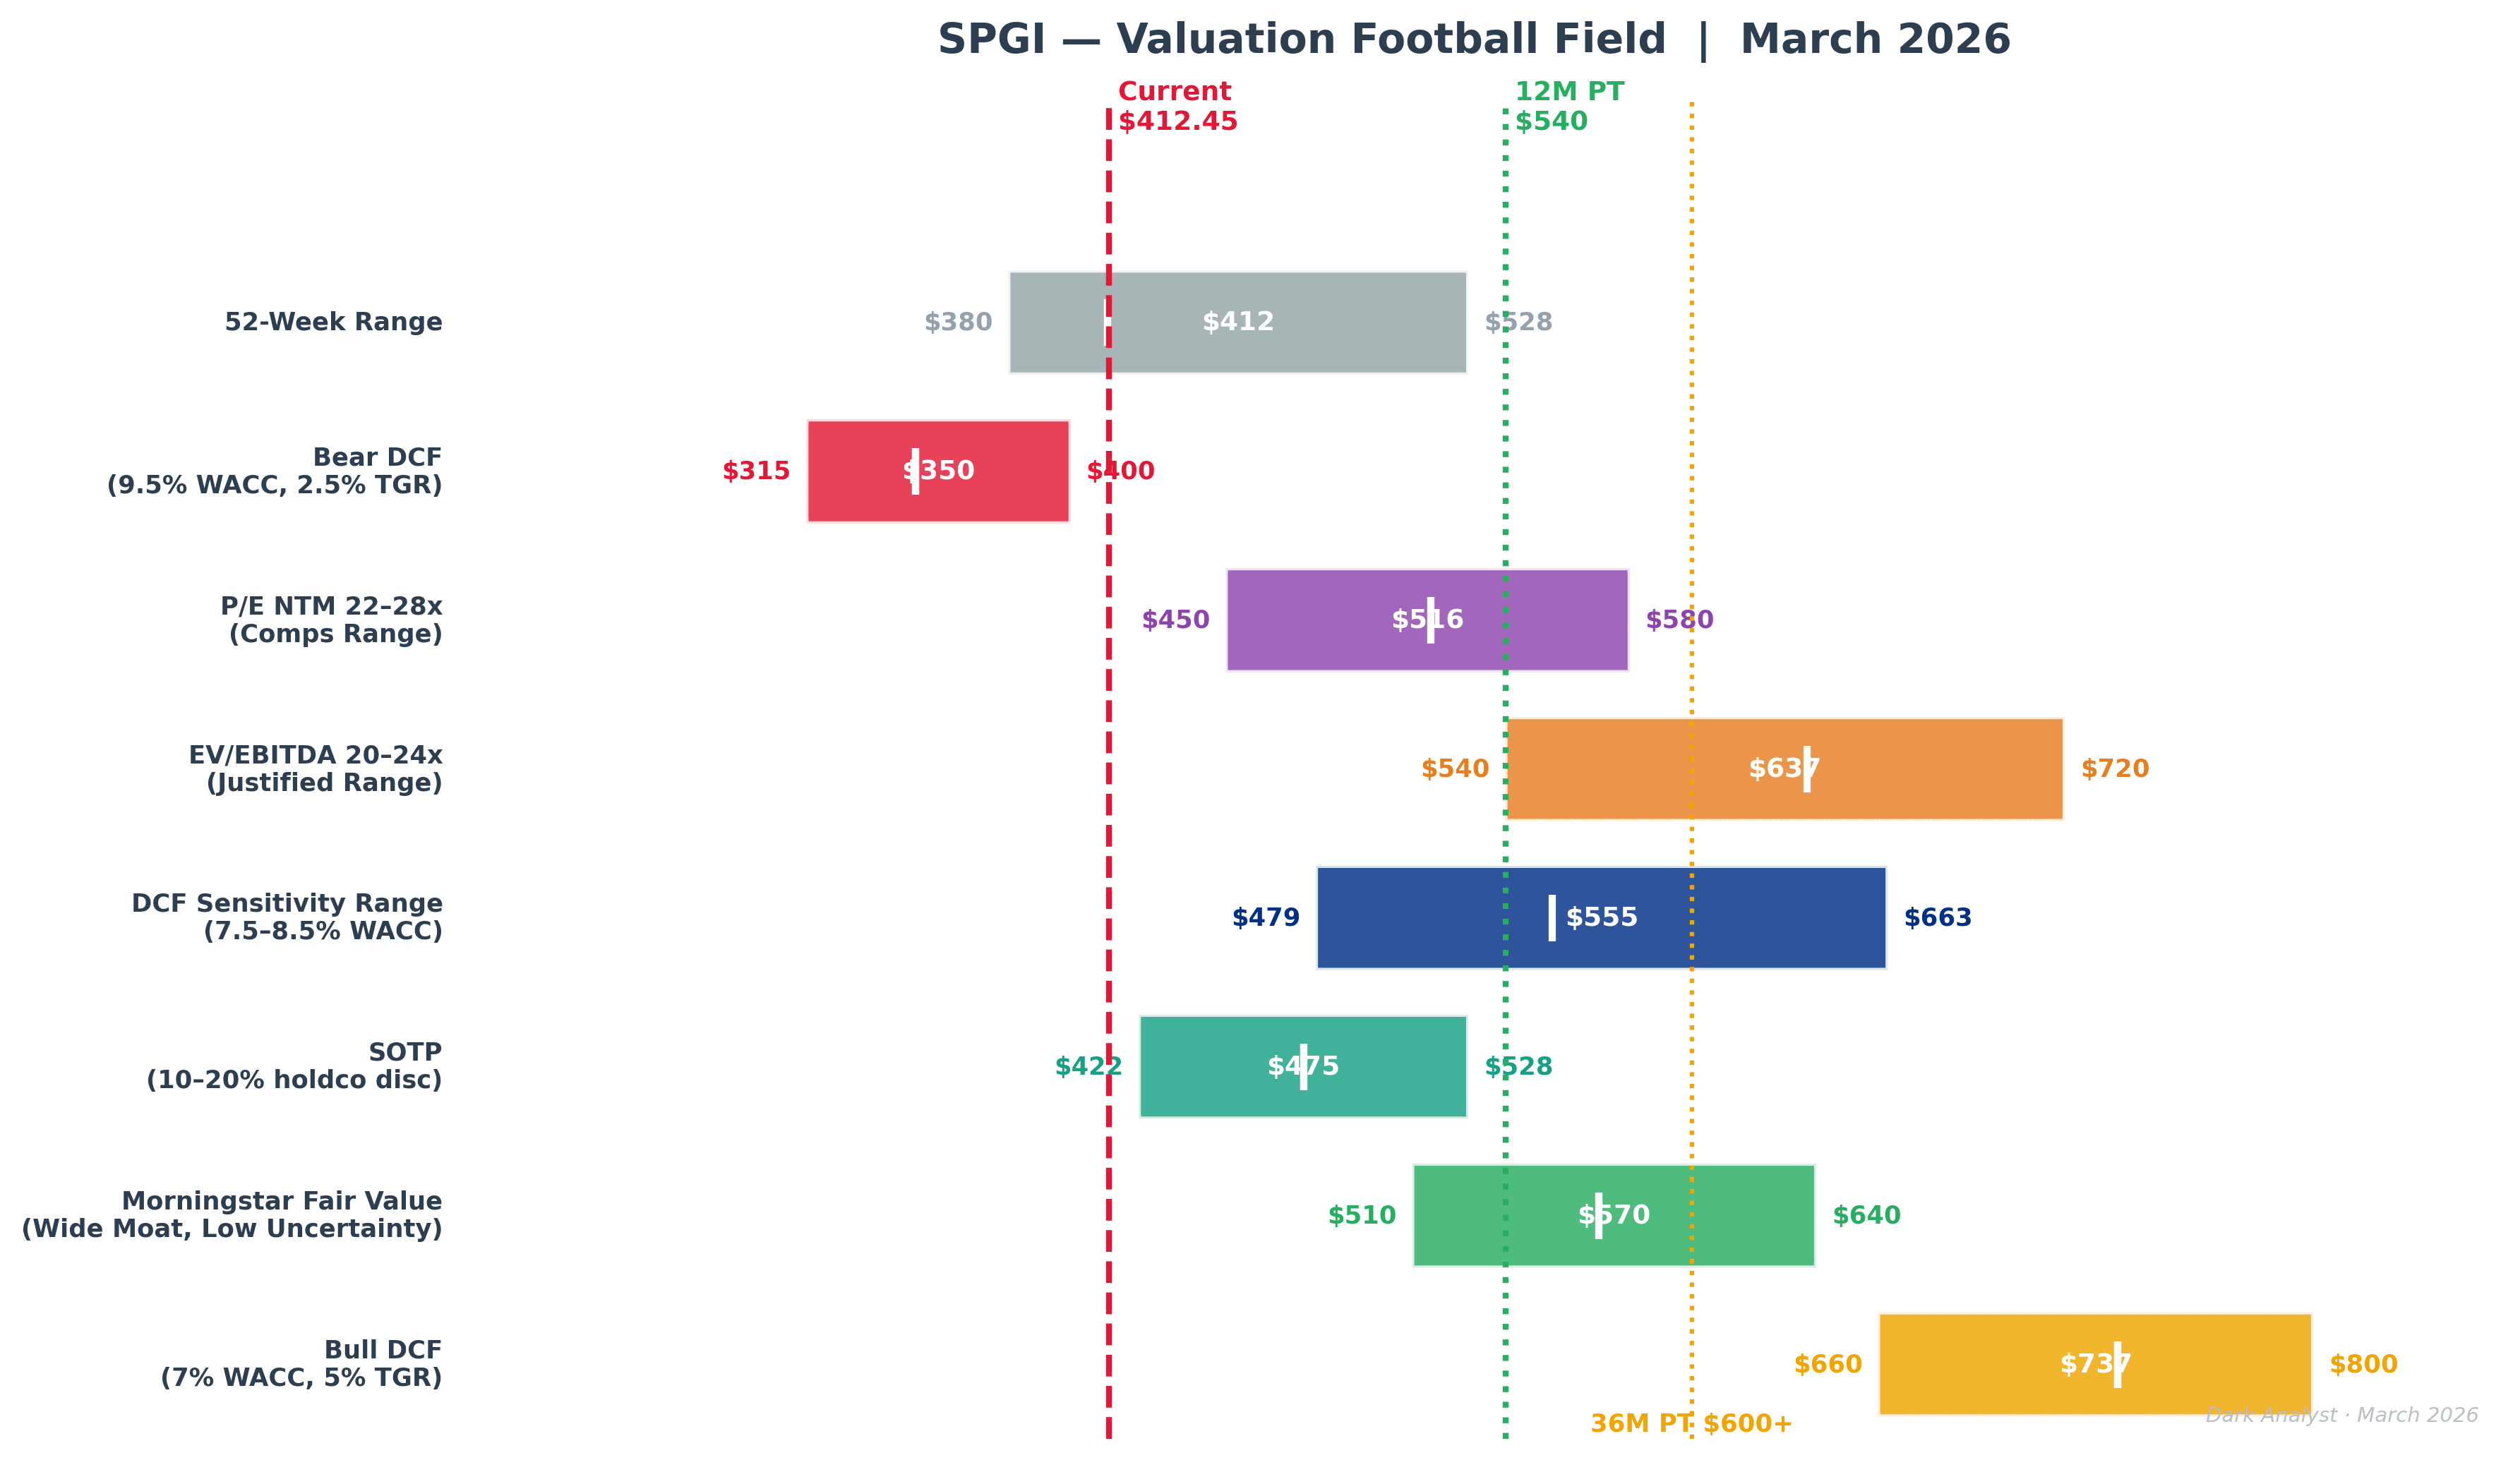
Our sum-of-the-parts, applying segment-level EV/EBITDA multiples benchmarked to the closest comparable in each category, values the business at $528 per share. Our DCF, using an 8.0% WACC and 4% terminal growth rate, yields $555 per share. We set a 12-month price target of $540, representing 34% upside from publication price.
S&P's single most valuable asset is the Indices division — a near-pure royalty business running the S&P 500 at 71% operating margins, with zero marginal cost to scale. The market is not pricing this correctly because it sits inside a conglomerate alongside a $1.75 billion automotive data business (CARFAX) that has nothing to do with financial benchmarking. S&P confidentially filed the Form 10 for the Mobility Global spin-off in Q4 2025; public filing and roadshow are expected Q2 2026, with completion in H2 2026. When the automotive business separates, the remaining S&P — a pure financial intelligence and benchmarking platform at ~51% blended operating margins — will be impossible to ignore at current multiples. Simplification events of this kind historically compress discount-to-peers by 2–4 turns of EBITDA.
Bear case: $350. Assumes persistent seat count attrition in Market Intelligence, Ratings revenue returning to 2023 lows, and WACC expansion to 11%. Bull case: $720+. Assumes private markets re-rating, Indices multiple expansion, and the Mobility spin-off driving full conglomerate discount removal.
Risks
MI Seat Count Compression. Financial institutions reducing headcount, rationalizing vendors, and exploring AI-assisted alternatives put Capital IQ Pro and SNL seat counts under pressure. ACV growth decelerated from 8–9% in 2023 to 6.5–7% in Q4 2025. If AI-assisted research tools erode the perceived need for full terminal seats, Market Intelligence growth could compress toward 4–5%, reducing segment contribution and weighing on consolidated revenue growth.
Private Credit Ratings Bypass. Private credit managers increasingly structure deals to avoid formal NRSRO ratings entirely, relying on internal credit analysis or independent third-party assessments. If this trend accelerates, the addressable market for private ratings and credit estimates grows more slowly than expected, limiting the private markets revenue thesis.
Ratings Revenue Cyclicality. Ratings revenue moves directly with global debt issuance volumes. In 2023, billed issuance fell approximately 6% as rate hikes froze the leveraged finance market. Management's 2026 guidance implies low-to-mid single-digit Ratings growth — below the 8% delivered in 2025 — reflecting conservative assumptions on investment-grade and high-yield issuance. A sharper-than-expected slowdown would impair near-term earnings and create multiple compression risk.
Interest Rate Sensitivity. Higher rates reduce refinancing activity and delay issuance decisions, cutting directly into Ratings segment revenue. The Iran conflict and persistent inflation have kept the Fed on hold in early 2026. If rate normalization delays by 12–18 months, the volume recovery thesis shifts out and the stock continues to trade at a discount.
Conclusion
S&P Global is a 165-year-old financial infrastructure monopoly trading at a six-turn discount to its closest peer. The current price reflects two transient concerns — AI pressure on Market Intelligence and a digestion year in Ratings — that have created an entry point in a business with structurally irreplaceable market position, 53 years of consecutive dividend growth, and a pending simplification catalyst in the Mobility spin-off.
The downside is protected. At $350 bear case, the market prices in a significant and lasting deterioration that runs against S&P's history through multiple cycles. The upside, at $540 on a 12-month basis and $600+ on a three-year view, is asymmetric relative to that floor.
We are buyers at current levels with a 3–5 year conviction hold.